The Science Behind BioHealthcare Club

The science
of you.


Powered by Independent Research

Harvard · Cambridge · Stanford

Blood, gut, DNA, BioBodyTrack and continuous BioHealth Band data — measured deeply, read together, and turned into a personalised picture of your health, performance, resilience and longevity.

Personalised Health Starts With Measurement

Understand
your biology.

At BioHealthcare Club, we combine blood biomarkers, gut microbiome analysis, DNA insights, wearable BioHealth Band data, bioinformatics, and BioBodyTrack to build a deeper picture of each client's health, performance, stress resilience, longevity potential, and disease-risk profile.

Our approach is based on a simple principle: what gets measured can be understood, improved, and tracked over time.

06Integrated data streams
24/7Continuous monitoring
01Personalised profile
Unmatched Breadth

We monitor the largest number of biomarkers of any biomedical health membership.

What We Measure

Six streams of data.
One picture of you.

01

Blood Biomarkers

What's happening inside

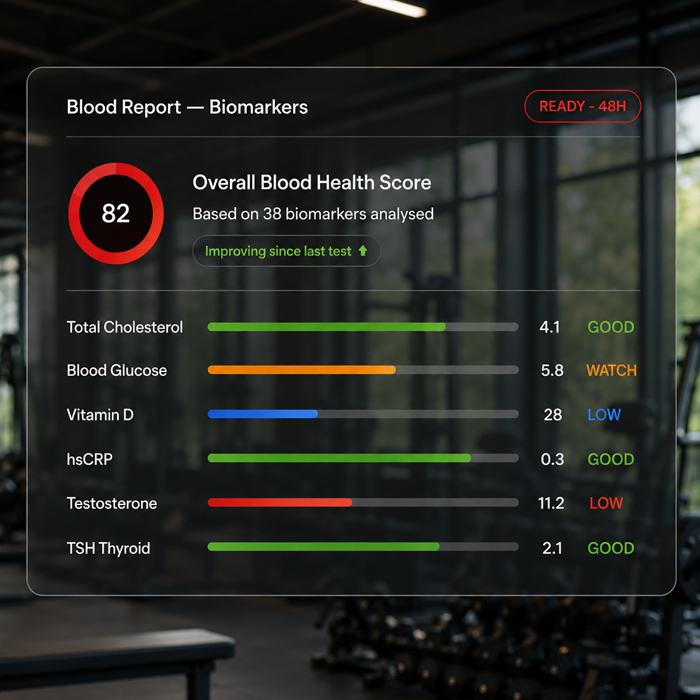
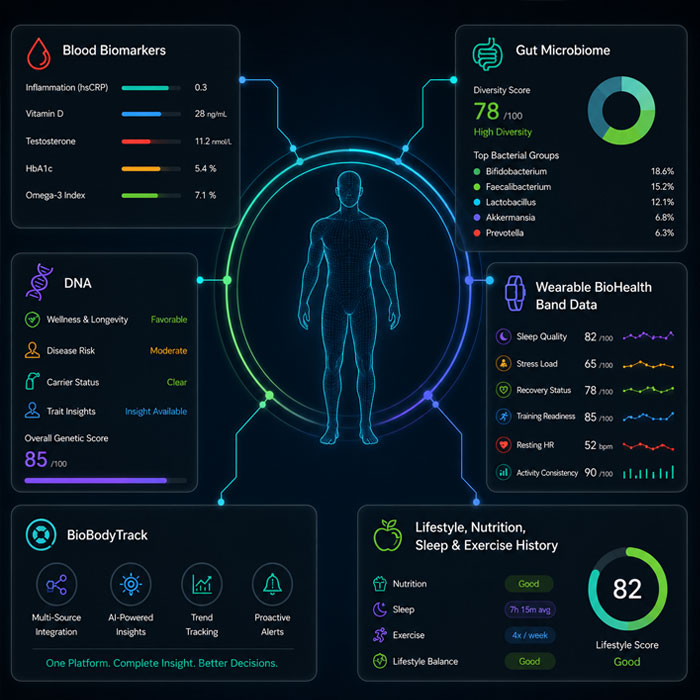
Blood testing reveals key signals linked to metabolism, cardiovascular health, inflammation, hormones, nutrition, liver and kidney function, glucose control, and recovery.

Clinical Evidence

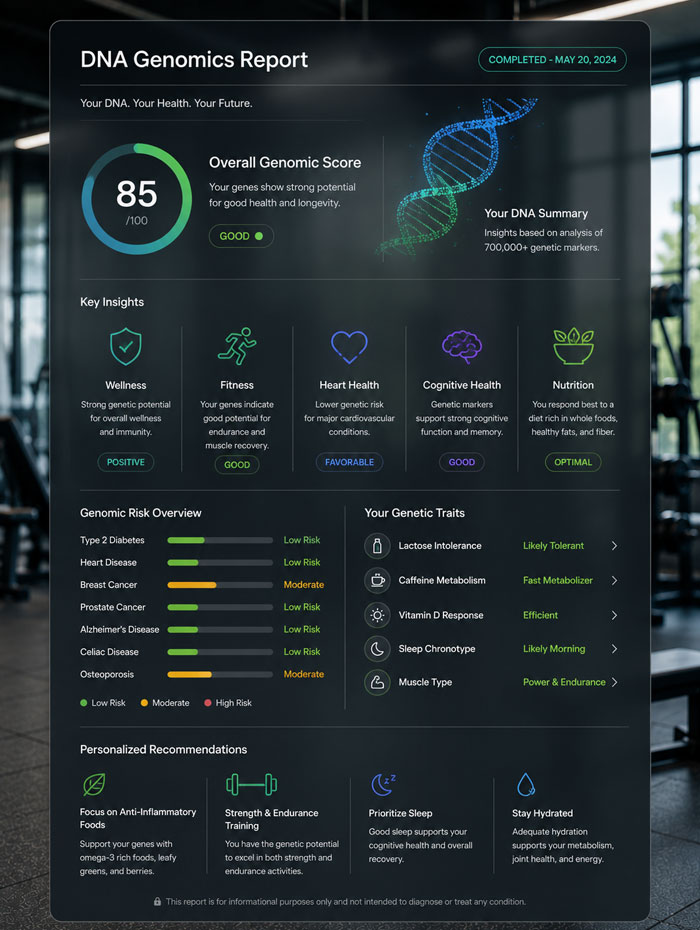
Research from Harvard-affiliated Brigham and Women's Hospital found that measuring blood markers such as LDL cholesterol, lipoprotein(a), and high-sensitivity CRP can help predict long-term cardiovascular risk decades in advance.1

This can help you understand
  • Energy and fatigue drivers
  • Cardiovascular risk
  • Blood sugar and insulin response
  • Inflammation and immune stress
  • Nutrient deficiencies
  • Hormonal balance
  • Recovery and overtraining risk
02

Gut Microbiome

Food · Metabolism · Immunity

The gut microbiome influences digestion, nutrient absorption, inflammation, metabolic health, and immune function. It is dynamic — changing with diet, exercise, medication, sleep, and lifestyle.

Clinical Evidence

Harvard research has linked gut microbiome patterns with obesity, heart-disease risk, and type 2 diabetes risk.3 King's College London also highlights the role of diet, fibre, prebiotics, probiotics, FODMAPs, and food components in gut health and gastrointestinal disease.4

This can help you understand
  • Digestive health
  • Food response
  • Inflammation patterns
  • Metabolic health
  • Immune resilience
  • Personalised nutrition opportunities
03

DNA & Genetic Risk

Predisposition, not destiny

DNA testing can help identify inherited predispositions that may influence disease risk, metabolism, nutrient needs, exercise response, and long-term prevention strategy.

Clinical Evidence

Oxford research notes that polygenic risk scores may help optimise screening programmes, because genetic risk can be measured from a single sample and remains stable throughout life.7 Cambridge researchers describe polygenic scores as a way to estimate predisposition — while cautioning that clinical use must account for uncertainty, bias, and responsible interpretation.8

Important Note

DNA is not a diagnosis. It is one layer of risk information, interpreted alongside blood markers, lifestyle, family history, symptoms, and clinical judgement.

This can support
  • Earlier prevention planning
  • Personalised screening decisions
  • Cardiovascular risk awareness
  • Nutrition and lifestyle personalisation
  • Understanding inherited risk factors
04

BioHealth Band

Continuous · 24 / 7

The BioHealth Band monitors day-to-day physiological signals such as heart rate, heart-rate variability, sleep, activity, recovery, and stress patterns — the data between clinic visits.

Clinical Evidence

Stanford researchers have shown that smartwatch and wearable data may help predict blood-test results and support scalable health monitoring.5 MIT research also highlights the future of wearable sensors for real-time monitoring and earlier intervention in chronic conditions.6

This helps you understand
  • Sleep quality
  • Stress load
  • Recovery status
  • Training readiness
  • Resting heart-rate trends
  • Activity consistency
  • Early changes in wellbeing
05

BioBodyTrack

Beyond weight & BMI

BioBodyTrack looks beyond scale weight to assess fat mass, lean muscle mass, visceral fat, hydration, and metabolic health indicators.

Clinical Evidence

Research highlights that BMI alone cannot assess fat distribution or distinguish between fat mass and muscle mass — making body composition a more informative measure for personalised health assessment.9

This helps you understand
  • Muscle-to-fat ratio
  • Visceral fat risk
  • Metabolic health
  • Strength and performance potential
  • Healthy ageing and sarcopenia risk
  • Weight-loss quality, not just weight loss
06

Bioinformatics

Data into personalised action

The real value comes from combining multiple data streams — blood biomarkers, gut microbiome, DNA, wearable BioHealth Band data, BioBodyTrack, and your lifestyle, nutrition, sleep and exercise history. Bioinformatics identifies patterns that may not be visible from any one test alone.

Clinical Evidence

Stanford's Integrated Personal Omics Profiling work was designed to understand healthy biochemical and physiological profiles through deep, longitudinal measurement.5 Harvard's precision-nutrition review notes that people can have very different glucose and triglyceride responses to the same meals — influenced by microbiome, sleep, activity, and meal timing.2

What we combine
  • Blood biomarkers
  • Gut microbiome
  • DNA
  • Wearable BioHealth Band data
  • BioBodyTrack
  • Lifestyle, nutrition, sleep & exercise history
The Technology · NGS

Powered by Next-Generation Sequencing.

Your DNA and gut microbiome aren't read one marker at a time — they're sequenced. Next-Generation Sequencing (NGS) reads millions of fragments of genetic code in parallel, turning a single sample into a high-resolution map of your genome and the trillions of microbes that live within you.

Clinical Evidence

NGS has revolutionised genomics — enabling the rapid, accurate and cost-effective analysis of large-scale genomic data, and the early detection of disease-causing variants in clinical practice. It is the same class of technology now central to precision medicine and rare-disease diagnosis.10

DNAWhole-genome & targeted genetic variants
GUTMicrobiome profiling by shotgun metagenomics
RISKInherited risk across many conditions at once
ONCEA stable baseline — sequenced once, referenced for life
Weight Management · GLP-1

Lose fat.
Keep your muscle.

GLP-1 medicines such as semaglutide and tirzepatide can drive remarkable weight loss — but not all of that weight is fat. Without the right support, a meaningful share comes from lean muscle: the tissue that protects your metabolism, strength and healthy ageing.

What the evidence shows

Body-composition sub-studies of GLP-1 weight-loss trials report that a substantial share of the weight lost — by some analyses up to around 40% — can come from lean mass rather than fat, underlining why muscle must be actively protected during treatment.12

SCANBioBodyTrack separates fat loss from muscle loss, month to month
BLOODBiomarkers track protein status, nutrition and metabolic health
GUTGut testing tracks digestion, nutrient absorption & GLP-1 tolerance
BANDThe BioHealth Band guides resistance training, activity and recovery
ADAPTYour programme adjusts to preserve lean mass as the weight comes off
Bioinformatics

Your whole biology,
computed.

A performance band tells you how hard you trained and how well you slept. Our bioinformatics engine starts there — then fuses those continuous signals with your blood, gut, DNA and body composition, and reads the whole picture together. The same live metrics you'd expect from a band like WHOOP — with clinical depth no wearable can reach on its own.

The Continuous Layer What a performance band tracks — e.g. WHOOP
  • Strain & daily load
  • Recovery score
  • Heart-rate variability (HRV)
  • Resting heart rate
  • Sleep stages & quality
  • Respiratory rate & blood oxygen
The Clinical Layers We Add Beyond any wearable, alone
  • Blood biomarkers — metabolism, hormones, inflammation
  • Gut microbiome — sequenced, not estimated
  • DNA & inherited risk
  • BioBodyTrack — fat, lean mass, visceral fat
  • Longitudinal multi-omics, tracked over time
  • Doctor-led clinical interpretation

Everything a performance band gives you — and the clinical depth it can't reach.

Perimenopause & Menopause

Built for the
menopause transition.

Perimenopause and menopause reshape the body's chemistry — hormones, metabolism, sleep, mood, bone and muscle all shift, often years before periods stop. Generic advice can't keep up with a moving target. Our testing makes the transition visible, so support is personalised and adjusted as you change.

What the evidence shows

Longitudinal research on the menopause transition shows that falling oestrogen accelerates the loss of bone density and lean muscle and shifts fat toward the abdomen, raising cardiometabolic risk. Because each of these changes is measurable, it can be tracked and managed rather than guessed at.13

HORMONESOestradiol, FSH, thyroid & related hormone panels
METABOLICGlucose, insulin & lipids, as risk shifts with oestrogen
BONE+MUSCLEBioBodyTrack & lean-mass tracked over time
SYMPTOMSBioHealth Band: sleep, HRV, temperature & stress load
DECISIONSPersonalised nutrition, training & informed HRT discussions

Measured deeply.
Read together.

The BioHealthcare Method
How This Helps You

From data
to direction.

The same biological picture serves several goals at once — sharper performance, greater resilience, a sharper mind, a longer healthspan, and disease caught earlier.

A

Performance

We identify biological bottlenecks that may affect energy, strength, endurance, recovery, and training response.

Low iron or B12 Poor sleep recovery Elevated inflammation Suboptimal body composition Blood-glucose instability Gut nutrient absorption
B

Stress & Resilience

Wearable metrics such as HRV, resting heart rate, and sleep help show how your body is responding to physical, emotional, and lifestyle stress.

Clinical Evidence

Heart-rate variability is widely studied as a marker of autonomic nervous-system function, stress, fatigue, and recovery — and is increasingly read through wearable sensors.5

C

Longevity

Longevity is not just about lifespan; it is about healthspan — living longer with better energy, mobility, metabolic health, and independence.

Cardiovascular risk Metabolic health Inflammation Muscle mass Visceral fat Sleep & recovery Nutritional status Gut health
D

Disease Prevention

Early risk detection allows earlier action — across cardiovascular disease, type 2 diabetes, metabolic dysfunction, inflammation, poor sleep health, nutrient deficiencies, and genetic predispositions.

Clinical Evidence

Stanford research has shown that individual blood-sugar responses to carbohydrates are shaped by insulin resistance, beta-cell function, and molecular profiles — supporting a more personalised approach to diabetes prevention.5

Brain & Cognition
E

Brain & Cognition

A sharp mind rests on the same foundations as a strong body — blood flow, metabolic health, sleep, and movement. We track the inputs that protect focus, memory and long-term brain health, then pair them with the physical and cognitive exercise that keeps your brain resilient.

Cardio-metabolic health Sleep quality HRV & stress load Body composition Gut–brain axis Physical & cognitive exercise
Clinical Evidence

In an umbrella review of randomised and observational studies, researchers at the Cambridge Centre for Sport & Exercise Science found that physical activity and exercise improve cognitive function in healthy adults and in those with mild cognitive impairment.11

Our Scientific Philosophy

We never rely on a single test, trend, or score.

We combine clinical testing, wearable monitoring, BioBodyTrack, and advanced analytics to create a personalised, evidence-informed health profile.

Measure
Understand
Personalise
Track
Improve
Clinical & Research References

The evidence behind the approach.

The summaries below reflect peer reviewed research and institutional publications that inform our approach. BioHealthcare Club is independent and is not affiliated with, endorsed by, or representing any of the institutions cited.

  1. 01
    Harvard · Brigham & Women’s Hospital
    Blood biomarkers and long-term cardiovascular risk.
    What the evidence showsIn a large cohort of women followed for around three decades, baseline LDL cholesterol, lipoprotein(a) and high-sensitivity CRP each independently predicted later heart attack and stroke risk visible decades before any symptoms.
  2. 02
    Harvard T.H. Chan School of Public Health
    Precision nutrition and personalised metabolic responses.
    What the evidence showsPeople show very different blood-sugar and triglyceride responses to identical meals — shaped by the microbiome, sleep, activity and meal timing which is why generic diets underperform and personalised nutrition is more accurate.
  3. 03
    Harvard Medical School / Harvard Chan
    Gut microbiome and type 2 diabetes risk.
    What the evidence showsSpecific shifts in gut-microbiome composition were associated with insulin resistance and a higher risk of type 2 diabetes, linking microbial patterns directly to metabolic health.
  4. 04
    King’s College London
    Gut health, diet and the microbiome.
    What the evidence showsDiet, fibre, prebiotics and probiotics measurably reshape the gut microbiome, and distinct microbial signatures track with better cardiometabolic health markers.
  5. 05
    Stanford Medicine
    Wearables, multi-omics and personalised metabolic health.
    What the evidence showsContinuous smartwatch signals could predict standard blood-test results and flag illness, inflammation and insulin resistance early; deep longitudinal “omics” profiling mapped what an individual’s healthy biology actually looks like.
  6. 06
    Massachusetts Institute of Technology
    Wearable sensors and real-time monitoring.
    What the evidence showsResearch into next-generation wearable sensors points toward real-time physiological monitoring that surfaces change early and enables earlier intervention in chronic conditions.
  7. 07
    University of Oxford
    Polygenic risk scores and preventive screening.
    What the evidence showsBecause genetic risk can be read from a single sample and stays stable for life, polygenic risk scores could help target and optimise preventive screening programmes.
  8. 08
    University of Cambridge
    Responsible use of polygenic risk scores.
    What the evidence showsPolygenic scores can estimate disease predisposition, but clinical use must account for uncertainty, bias and careful interpretation — risk information, never a diagnosis.
  9. 09
    European Journal of Preventive Cardiology
    Body composition beyond BMI.
    What the evidence showsBMI alone cannot capture fat distribution or separate fat mass from muscle; direct body-composition measurement gives a more informative read on cardiovascular and metabolic risk.
  10. 10
    Next-Generation Sequencing · Precision Medicine
    NGS in clinical diagnosis and precision medicine.
    What the evidence showsNext-Generation Sequencing, paired with bioinformatics, enables rapid, accurate and cost-effective analysis of large-scale genomic data — revolutionising genome sequencing and allowing earlier detection of disease-causing variants in clinical practice.
  11. 11
    Cambridge Centre for Sport & Exercise Science
    Exercise and cognitive function.
    What the evidence showsAn umbrella review of randomised and observational studies found that physical activity and exercise improve cognitive function in healthy adults and in people with mild cognitive impairment.
  12. 12
    GLP-1 Therapy · Body Composition
    Lean-mass loss during GLP-1 weight loss.
    What the evidence showsAcross body-composition sub-studies of GLP-1 receptor-agonist weight-loss trials, a substantial proportion of total weight lost — up to roughly 40% in some analyses — was lean body mass, making active muscle preservation a priority throughout treatment.
  13. 13
    Menopause Transition · Cardiometabolic & Bone Health
    Body-composition, bone and cardiometabolic change across menopause.
    What the evidence showsLongitudinal cohort research on the menopause transition shows that declining oestrogen accelerates bone-density and lean-muscle loss and drives fat toward the abdomen, raising cardiometabolic and cardiovascular risk — changes that are measurable, and therefore modifiable with targeted support.
  14. 14
    Sleep Quality · Metabolic & Cognitive Health
    Impact of sleep duration and quality on metabolic function and cognitive performance.
    What the evidence showsResearch from the Harvard Medical School Division of Sleep Medicine indicates that chronic poor sleep is associated with elevated cortisol, impaired glucose regulation, reduced immune function, and accelerated cognitive decline — highlighting sleep as a primary biological lever, not a lifestyle afterthought.
The Journey

How it
works.

A continuous loop, not a one-off test. We establish your baseline, read it together, build your plan, monitor day to day — then re-test and refine.

Day One

Baseline

A full panel — blood, gut, DNA and BioBodyTrack — plus your BioHealth Band, fitted and syncing.

Within 7 Days

Results, read together

Bioinformatics fuses every data stream; a BioHealthcare doctor reviews and interprets your complete profile.

Week Two

Your plan

Nutrition, training, recovery, supplementation and any medical actions — built around your biology, not averages.

Ongoing

Continuous monitoring

Your BioHealth Band tracks sleep, recovery, HRV and activity day to day, keeping the plan live.

Every 3–6 Months

Re-test & optimise

We re-measure, compare against your baseline, and refine — closing the loop and compounding your gains.

Re-tested every 3–6 months each cycle sharper than the last.

Measure · Understand · Personalise · Track · Improve

Start with measurement.

Your personalised, evidence-informed health profile begins with a single comprehensive assessment — read together by your biomedical team.